Make a Data Logger!
Overview
Let's get some hands-on experience with the continuous input values provided by other analog sensors: accelerometers, distance rangers, and the like. We'll also get to play around with the count-based rotary encoder. We'll then record the data to the EEPROM of the Arduino Micro and play it back on your LCD display and serial monitor.
In The Report
Include your responses and uploads to the green questions. Include snippets of code that explain what you did. Embed a video demo of your data logger, and please follow the Lab Report Guidelines. Deliverables are due one week after your lab session. Post your lab reports as 'wiki' pages.
Kit Parts
Don't forget to collect the new parts for your kits from an instructor!
Part A. Writing to the Serial Monitor
By now you've probably wished more than a few times that you could ask Arduino Micro what is up when things don't work the way you think they should! Hook up the simple potentiometer voltage divider circuit from lab 3 (Please note that we have changed voltage to +5V here).

The LCD display from the last lab is a great and helpful tool for debug purposes; the serial monitor is another. Use the code from File->Examples->Communication->Graph as a template to print data from your potentiometer to the serial monitor. Don't disconnect the USB cable after uploading the code; instead, use the serial monitor button on the Arduino IDE (in the upper right corner; it looks like a magnifying glass) to see the data coming from the Arduino Micro. You might have to select a different COM port under Tools->Serial Port.
a. Based on the readings from the serial monitor, what is the range of the analog values being read?
b. How many bits of resolution does the analog to digital converter (ADC) on the Atmega32U4 have (hint: where might you look to find this sort of thing)? How many are you using with the range of values you're seeing?
You can also read inputs from the serial monitor, or wait for the serial monitor to open before spewing data over the USB line! A nice tutorial on the basic serial transmit functions can be found at http://arduino.cc/en/Tutorial/AnalogReadSerial. You can see from the sample code included in the comments of the Graph program that you could use the serial communication functions to communicate data from your sensors to other programs, such as Processing, Flash, MaxMSP.
For this lab, you can use the serial monitor and/or the LCD whenever you are told to display something, depending on what you think is easier/prettier.
Part B. Voltage Varying Sensors
Some more sophisticated sensors have ICs that measure physical phenomena and then output an analog voltage level, varying voltage much as a voltage divider circuit would.
1. IR Distance Sensor
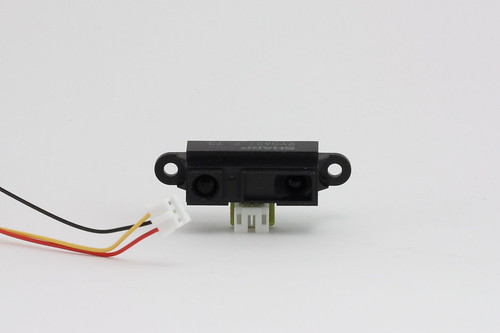
(Note: Our connection cables are WHITE, BLACK, and RED)
Get an IR distance sensor and an IR distance sensor jumper cable from an instructor if the sensor doesn't already have one. The circuit for the distance sensor is simple: just connect red to +5V, black to ground, and white to analog input 0.
IR Sensor Datasheet
More Info on Sharp Distance Sensors
Use your Lowly Multimeter program to look at the data the sensor returns. What happens when the field of view is clear? Move your hand or a piece of paper over the sensor and see how the readings vary with distance.
a. Describe the voltage change over the sensing range of the sensor. A sketch of voltage vs. distance would work also. Does it match up with what you expect from the datasheet?
2. Accelerometer

The accelerometer in your kit is a 3-axis, selectable range accelerometer based on the MMA7361 chip from Freescale.
Datasheet
Board Schematic
Product Page
As the product page points out,
The 3-Axis Accelerometer sensor will operate between 2.2 and 6 volts. Because the MMA7361 chip only will deal with 3.6 volts maximum, the sensor is equipped with a low-dropout regulator so the sensor will work, out of the box, with an Arduino or other 5 volt microcontroller. At 5 volts the sensor draws around 50 uA with the shunt off and 100 uA with the shunt on. The current draw at 3.3 V is 150 / 200 uA respectively.
The 3-axis accelerometer module comes as a kit with 5-pin male headers, a two pin header, and a shunt for G selection. The sensor defaults to 1.5G so you don't have to install the two pin header if you are only using the more sensitive setting.
The acceleration in the x, y, and z directions is reported out as an analog voltage. The pins of the accelerometer are labelled in white on its board. They are as follows:
- G - Ground
- Vin - Voltage, 3.3V
- Xo- X axis output, 0 - 3.3V
- Yo- Y axis output, 0 - 3.3V
- Zo- Z axis output, 0 - 3.3V
- G - Ground
- 3V0 - 3.3V output from the voltage regulator
- GS - tie low for 1.5g sensing, high for 6g sensing
- ST - self test pin (not needed for this assignment)
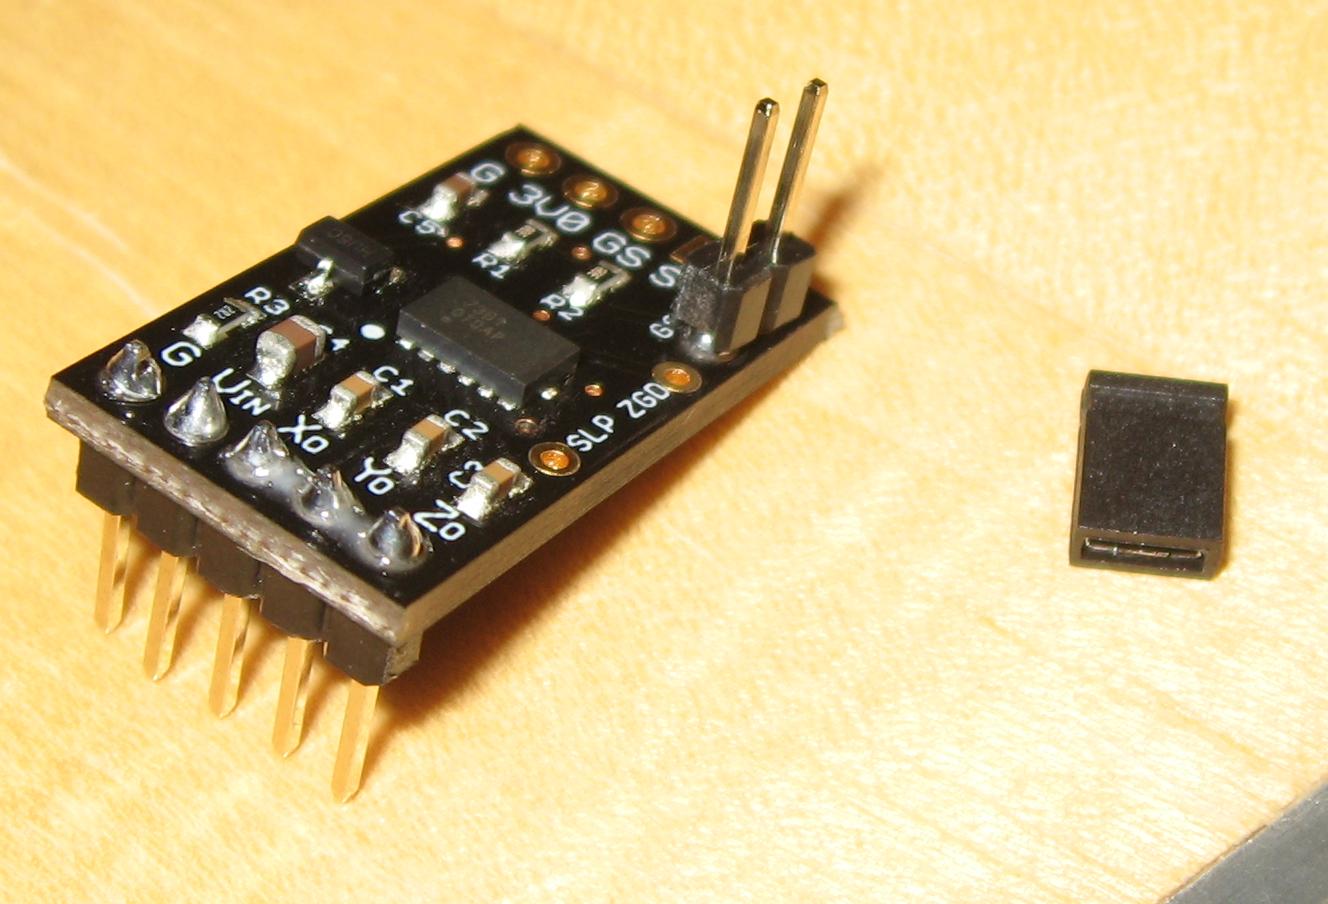
You will need to solder the 5 pin header to the accelerometer board. (Optionally, you can also solder the 2 pin header as shown below. The little black thing in the photo below is the 'shunt.' If you slide it on the 2 pin header, it will connect GS to 3.3V, selecting the 6g operation. If left unconnected, it will be in the 1.5g high-sensitivity mode (there's an internal pull-down resistor). The lab instructions below assume 1.5g.)

The connections you need to make are G to ground, Vin to 3.3V, and Xo to analog pin A3, Yo to analog pin A2, and Zo to analog pin A1 on the Arduino Micro board.
This example code is meant to read values from a 3-axis accelerometer out to a computer over the serial monitor. Test it out!
Use your mighty coding skills to indicate what your readings are on the X, Y and Z axes of the accelerometer on your LCD panel!
Now, get a feel for the data the accelerometer provides. Pick up the Arduino Micro+accelerometer board and tilt it in various directions. Start by holding it so that the accelerometer board is parallel to the ground. Find in which direction the X reading increases and decreases; do the same for the Y reading.
a. Include your accelerometer read-out code in your write-up.
Part C. Count/Time-Based Sensors
One last type of sensor!
1. Rotary Encoder

We have a high-quality 24 pulse encoder with knob and nice, click-y rotation detents.
Product Page
Datasheet
Like a potentiometer, a rotary encoder has 3 pins; unlike a potentiometer, an encoder can be spun round and round without stop. Rotary encoders use quadrature to tell how fast and in which direction you are turning a knob. To connect the encoder to your breadboard, you can insert three pins directly into motherboard like picture below.

The circuit below is the "correct" way of hooking up a rotary encoder with your Arduino Micro; the resistors and capacitors help to filter out noise from the mechanical operation of the encoder - this circuit diagram is from the datasheet.
However, to actually hook up your encoder, just use the 3-pin side. Hook the middle to ground, and the "A" and "B" pins to digital pins 9 and 10 of your Arduino Micro.
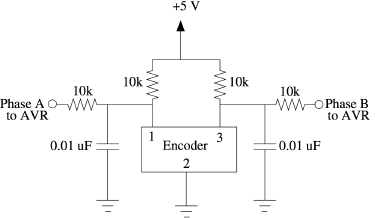
What is going on in this circuit? The Phase A and Phase B pins actually behave like switches, so the pins have pull-ups so that they will be high by default, until they are pulled low by the encoder (your Arduino Micro actually uses its own internal pull-ups). The resistor and capacitor combo also forms a low-pass circuit to eliminate stray voltage spikes that might occur from the quick switching (this is called "debouncing"). You can use any capacitor that is up to an order of magnitude away from the 10nF value.
Use the following rotary encoder code to see if you have hooked the encoder up correctly!
a. Upload a picture of your rotary encoder in action!
Part D. Logging values to the EEPROM and reading them back
1. Design your logger
Think about some thing that could be logged using the sensors you've learned to use! It's okay if the application is somewhat fictional; it's just nice to have a story in mind that drives your design.
Your data logger will have two main modes: one where it logs data and another where it plays the data back. Think a little about what sensors you would like to log data from and how you would like to display your data. Create a state diagram sketch that indicates how you'd like to switch between one mode and the other, and also what you'd like the program to do in each state. This can help you decide what buttons or knobs might be useful for your design.
You might make changes to your design before this lab is complete.
a. Turn in a copy of your final state diagram.
2. Reading and writing values to the EEPROM
You might remember from our Microcontroller Architecture lecture that the Atmega32U4 on Arduino Micro has 1K bytes of internal EEPROM (Wikipedia's EEPROM page).
a. How many byte-sized data samples can you store on the Atmega32U4?
b. How would you get your analog data from the ADC to be byte-sized?
Use the code in the File->Examples->EEPROM as a template to write and read your own analog values to Arduino Micro's EEPROM. (Ignore what they say about the EEPROM having only 512 bytes. You'll have to adjust your code to match the EEPROM size of the Arduino Micro. The Atmega32U4 datasheet tells you how much EEPROM it has too).
EEPROM Library Functions
3. Create your data logger!
Now it's up to you to integrate the software and hardware necessary to interface with your data logger! Your logger should be able to record a stream of analog data (at a sample rate of your desire) and then play it back at some later point in time. You are welcome to play back to either the 16x2 LCD or the serial monitor. Because the EEPROM is non-volatile, you should be able to play back the data long after you initially recorded it/unplugged your Arduino Micro!
a. Use the lab camera or your own camera/cell phone to record and upload a short demo video of your logger in action.
b. Post a link to the Lab 4 Data Logger Hall of Fame.
Again, the best data logger wins a $10 gift certificate at Sparkfun. Sweet!...Dude!
Comments (0)
You don't have permission to comment on this page.